Issuer filings
MD&A, annual and interim reports, and statements from each REIT's disclosures. Available references stay attached; page links appear only when the required context exists.
Canadian REITs · IFRS-native · filing-grounded
Coverage — 32 issuers
Platform — one research record
No spreadsheets, no PDF archaeology. Filing-derived metrics retain source context.
Provenance — primary documents first
MD&A, annual and interim reports, and statements from each REIT's disclosures. Available references stay attached; page links appear only when the required context exists.
Structured 4-section summaries cover narrative, executive commentary, guidance, and analyst Q&A. Where a transcript audit has run, its result is recorded on the methodology page.
Primary documents first. Market data stays distinct.
Each valuation method stays named and separately sourced.
Reported NAV, Real Estate NAV, and Market-Implied NAV stay separate. Read the valuation methodology →
AI analyst — filing grounded
Answers cite the MD&A or transcript source used.
Choose a period for results, guidance, and management commentary.
Ask about WALE (weighted average lease expiry), occupancy, cap rates, leasing, development, and transactions.
Add city and sector context from consolidated broker-report research.
Example AI analyst answer
Open a current sample analysisQuestion: What stood out in CHP.UN's Q1 2026 results?
Choice Properties delivered Q1 2026 FFO per diluted unit of $0.271, up 2.7% YoY, with a 3.0% same-asset cash NOI growth driven by higher rental rates on renewals, new leasing, and contractual rent steps, while overall occupancy held at 98.1%. The REIT announced an agreement to acquire approximately $5 billion of First Capital REIT's retail assets, and advanced value-creation initiatives including the Bloor and Dundas revitalization.
Actual output from the CHP.UN analyst, June 2026.
Built for Canadian REIT research.
Product record — annotated figures
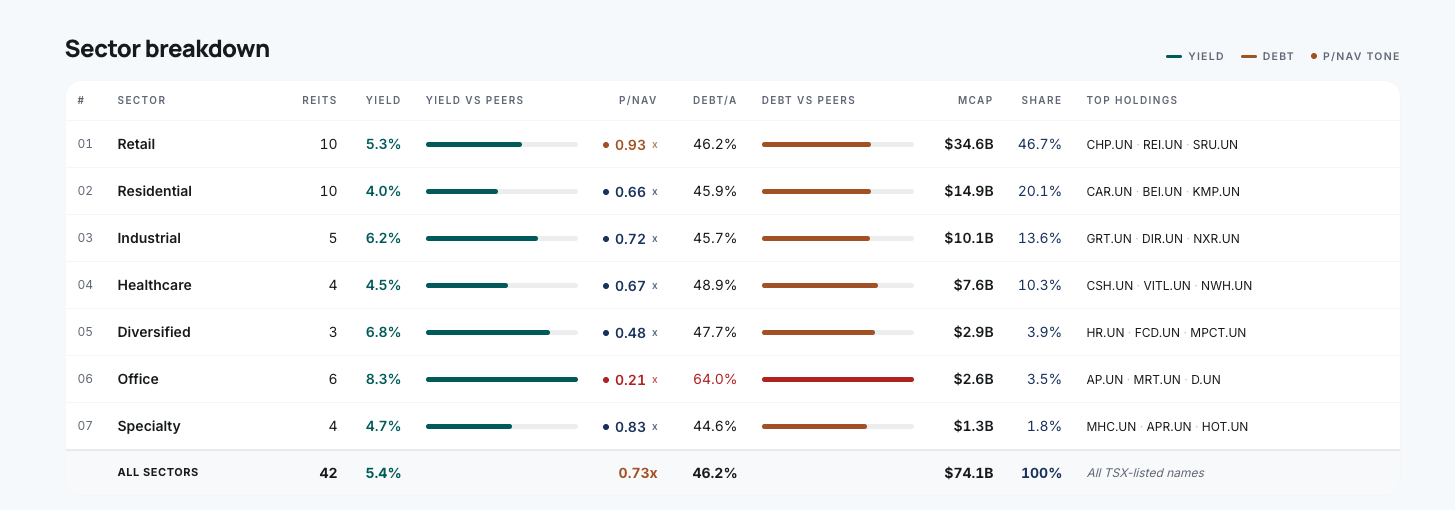
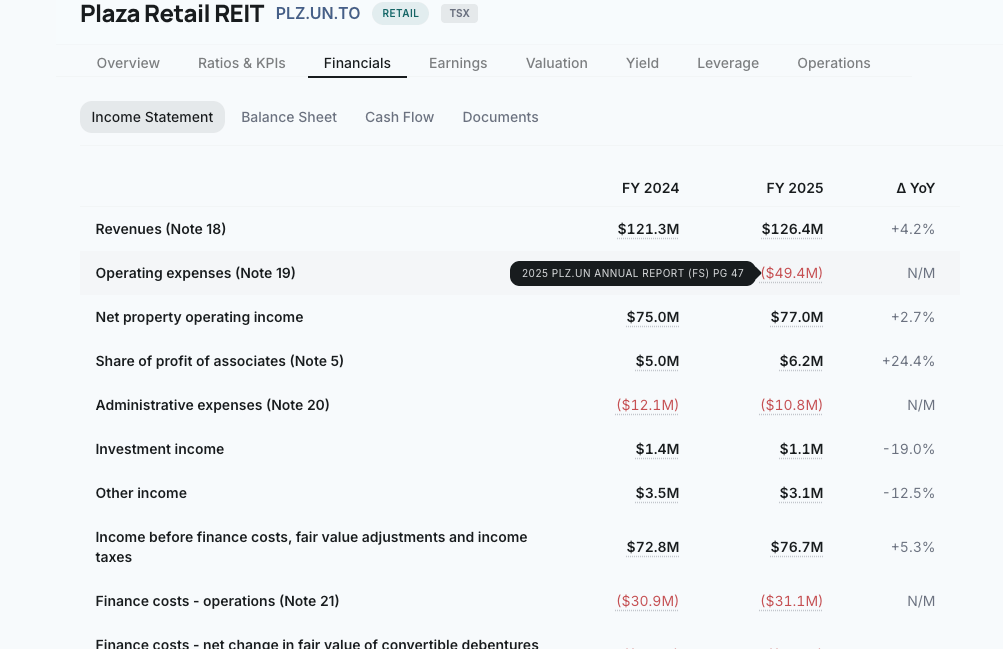
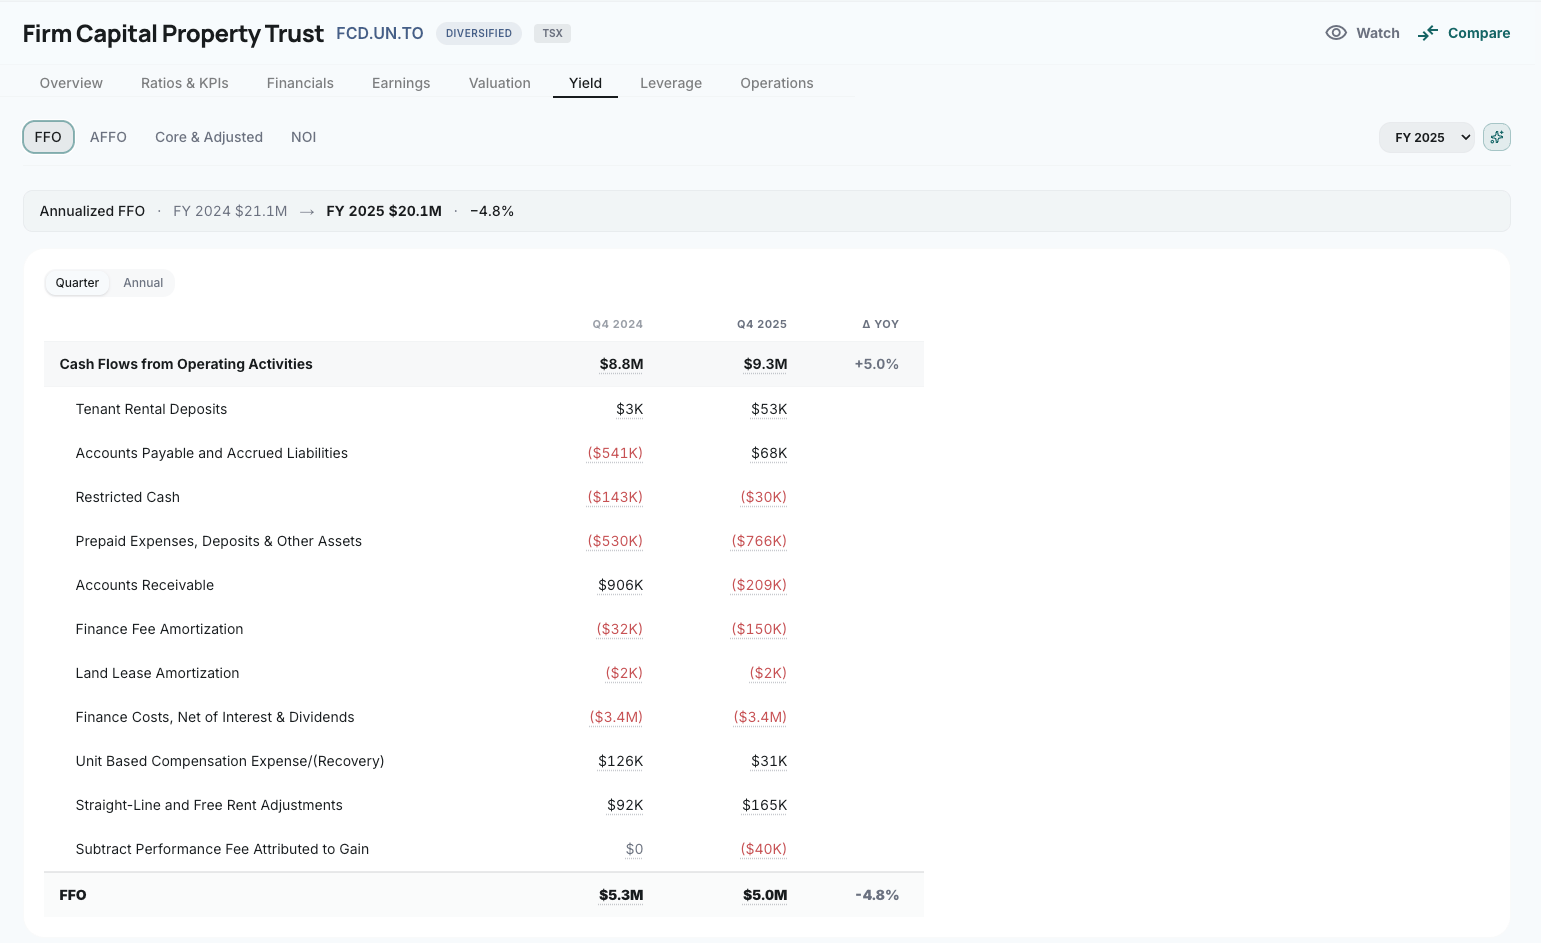
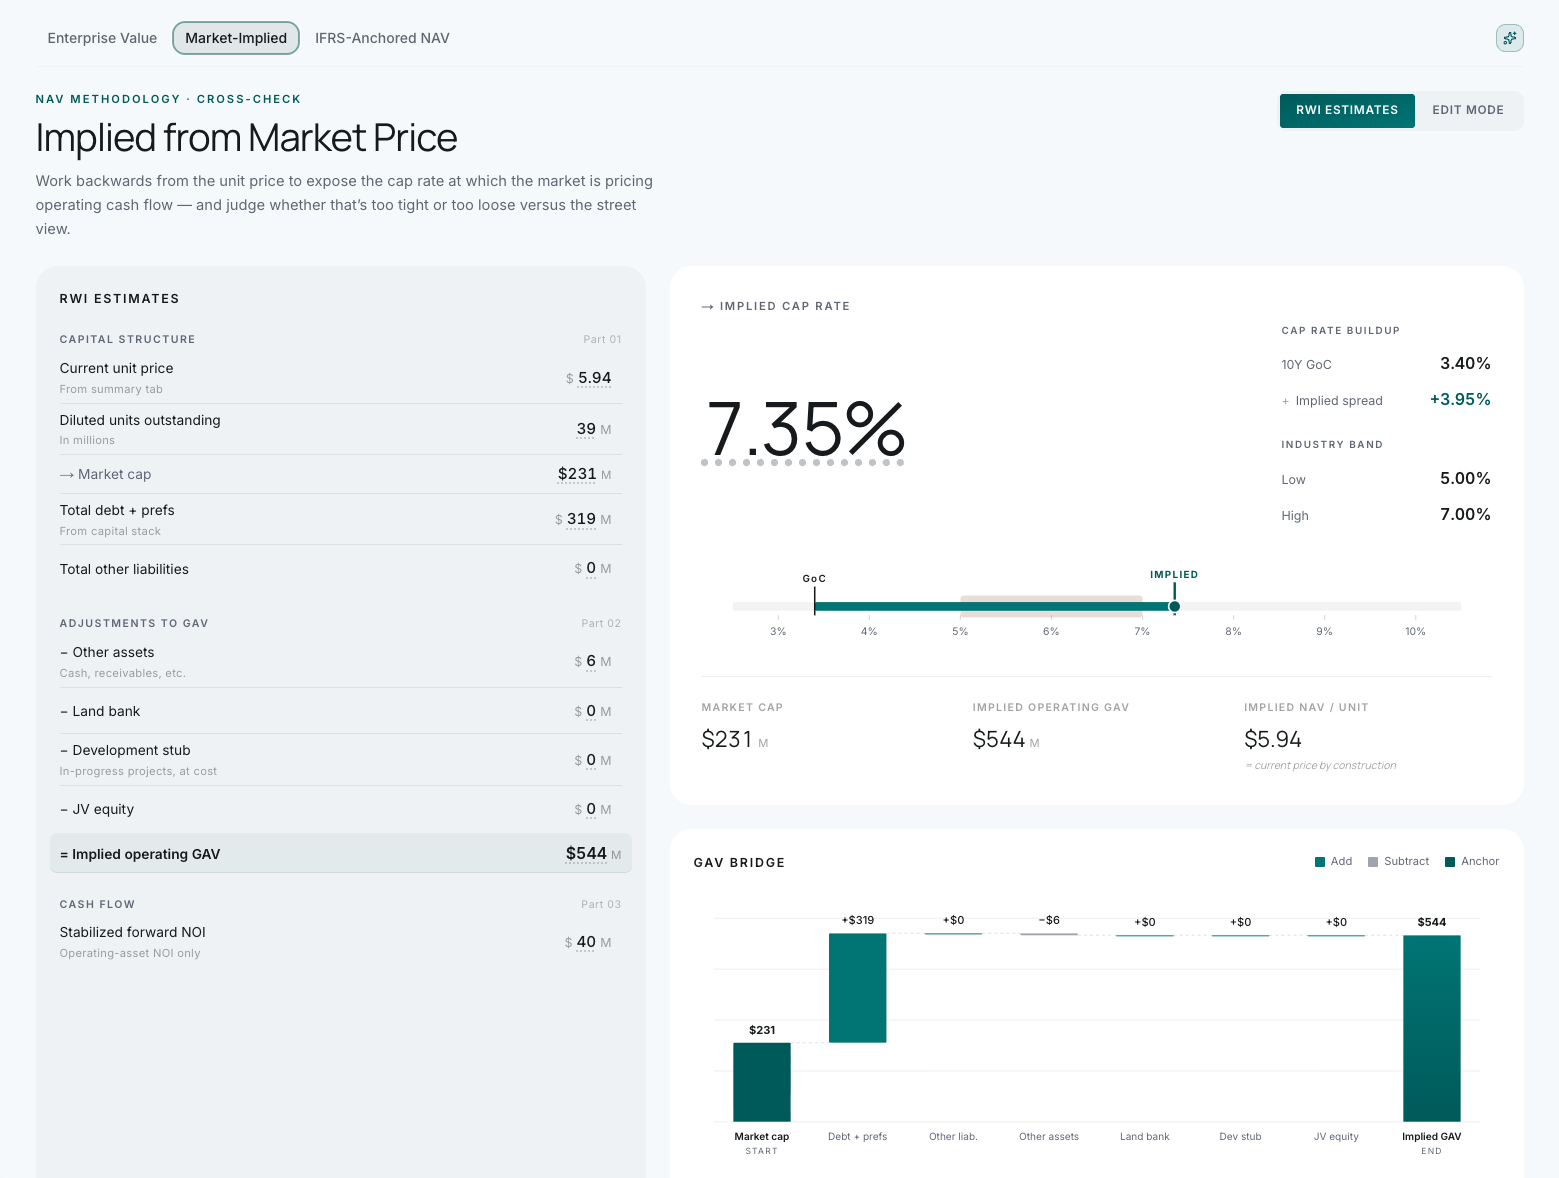
Not a generic stock screen
| Generic screener | REIT Stack |
|---|---|
| EPS, P/E, revenue, and broad equity factors. | FFO, AFFO, payout ratios, leverage, and occupancy. |
| One standard market multiple. | Reported NAV, Real Estate NAV, Market-Implied NAV, and implied cap rates. |
| Standardized fields without the filing trail. | Available filing context stays attached to extracted figures. |
| Omits debt ladders, WALE, same-property NOI, and leasing tables. | Normalizes REIT-native MD&A and supplemental schedules. |
Editorial ledger
Vital Infrastructure completed its 33-property European exit to TPG Real Estate on June 30, closing the German leg after the Netherlands portfolio transferred in April.
Nexus appointed Curt Millar to its board on July 2 as Bradley Cutsey resigned, creating a same-day trustee change after the REIT's C$500 million debut debenture offering.
Plaza Retail is evaluating Axia Real Assets' unsolicited C$5.28-per-unit proposal, a roughly C$1.23 billion take-private approach carrying a 21% premium but no binding agreement yet.
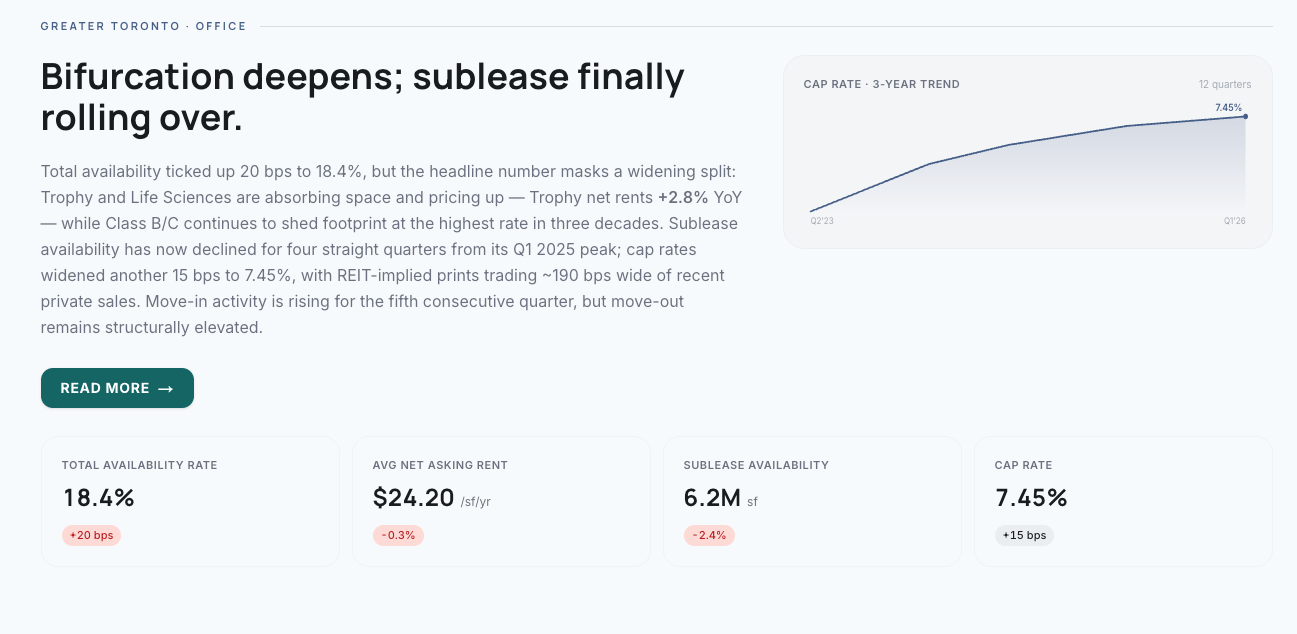
Greater Toronto's industrial market opened 2026 with the same theme its brokers had been tracking since late last year: demand is firming, supply is thinning, and rents are still resetting — but more slowly. Across all six brokerage reports, the first quarter reads as a market that has moved past its tightest point and is searching for a new balance rather than weakening further.
New REIT Stack briefings when they publish. No promotion. Unsubscribe anytime.
Or read the full briefings archive →
Founder-led
Kass Melle spent nine years in real estate private equity and development, including leading an 800,000 sq. ft. mixed-use project to over 95% occupancy. He later built AI-driven prop-tech ventures and studied finance at UBC Sauder and real estate development at Columbia GSAPP. He leads the team behind REIT Stack.
Founded in 2026.
Access ledger
Get started
All 32 actively tracked REITs · screener · tracker
See plan detailsActive research
Full REIT tabs · history · AI analyst · exports
See plan detailsResearch depth
Briefings · weekly roundups · broker-report research
See plan detailsCustom terms
Multi-seat access scoped per agreement · custom research · direct support
Talk to usReference desk
Open the Canadian REIT ledger
Free access across all 32 actively tracked Canadian REITs. Upgrade for full history, exports, and deeper research.